Text Customer Service Report Interpretation: Single Indicator Trends, Peak Values, and Anomaly Alerts
The text indicates that the chart displays highs and lows, abnormal fluctuations, and the trend direction within the selected time period. Supervisors can first locate the location of the change and then determine the cause by referring to business records.
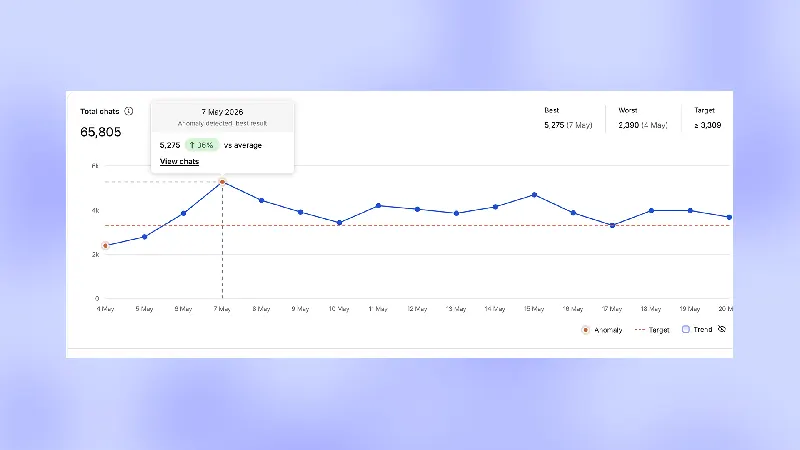
Choose a metric that your team actually tracks, maintaining the same region, channel, and time frame. First, identify when the highest and lowest values correspond to, then check for anomaly markers. A high point simply indicates the highest day; an anomaly indicates that the value differs from the metric's usual performance, although the two may overlap.
Expand or narrow the date range; the trend direction will be calculated based on the currently selected range. Therefore, the direction for a month may differ from that for a week; the time window should be specified in the report. Align promotions, holidays, channel launches, and scheduling changes with abnormal days before discussing whether adjustments to customer service configurations are necessary.
This update describes single-indicator reports. The ability to display multiple curves on the same graph and adjust sensitivity individually should not be directly extrapolated from this update. Numerical anomalies cannot be explained by a single factor; reviewing actual sessions for that period is necessary.